PTnova BI
Meaningful sales information:
Easily create reports, dashboards and forecasts
- Instant 360-degree view of sales and customer data
- Solid decisions thanks to transparent corporate data
- Identify and leverage customer structures according to criteria such as customer type, age or ticket turnover.
- Sales statistics, network evaluations, turnover statistics etc. with just a few clicks
- User-specific reports without programming knowledge
- Month-end closing, offer evaluation, customer analyses: all in a single tool
Sound decision-making processes
thanks to valuable business data
The PTnova customer management system provides you with valuable information about your customers and sales processes by default. This includes fares, products, customers and subscriptions as well as prosecution of offences or ticket sales channels. In the past, it was difficult to make this information available, and doing so involved a major manual effort; moreover, the quickly outdated reports were hard to manage.
With PTnova BI, you can now visualize and evaluate your valuable customer and sales data quickly and easily at any time. This allows you to further optimize your sales processes, improve the quality of your marketing campaigns, make sound decisions and consistently increase your business success.
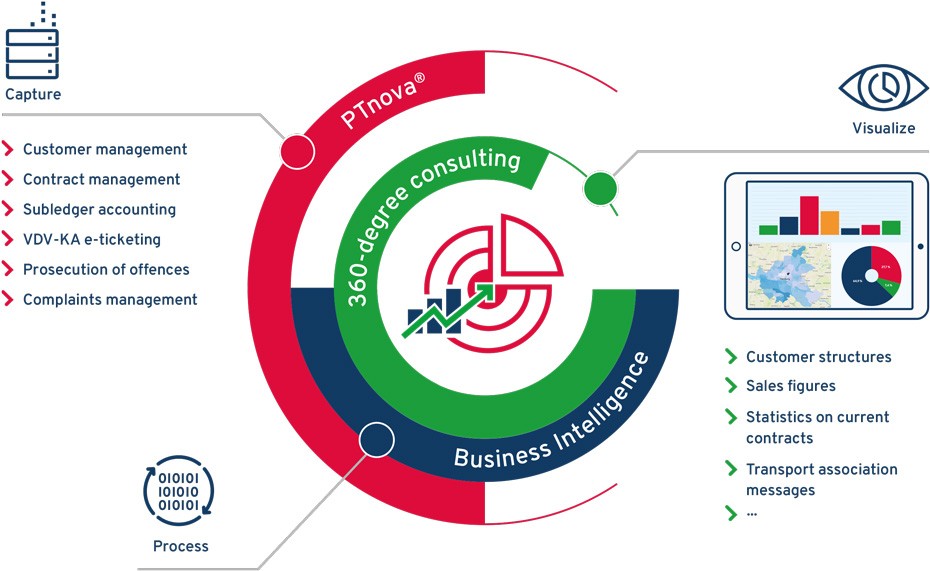
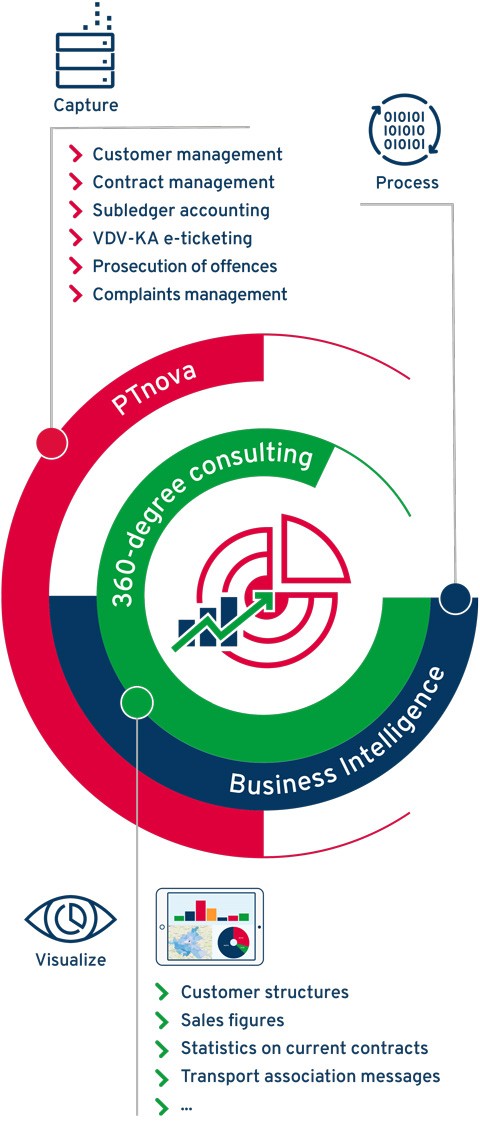
Visualize and Leverage Existing Knowledge
Capture, process, visualize
PTnova BI acts as the interface between your PTnova system and any external business intelligence system. PTnova BI supports you in making the customer and sales data stored in PTnova available for comprehensive analyses, individually tailored to your requirements.
Together with your business intelligence system (e.g. SAP, IBM Cognos Analytics), PTnova provides the basis for automating your reporting as well as for creating dashboards and detailed forecasts. This empowers your users to create custom reports based on PTnova data without the need for programming skills.
The data stored in PTnova is transferred directly to your business intelligence system, where it is processed further to prepare for on-demand visualization. For example, you can evaluate and visualize key figures such as turnover, contribution margin, average age or customer affiliation according to criteria such as customer types, contract types, products or points of sale.
Safe data exchange
Based on SAP standard technology, PTnova BI ensures robust and reliable operation. The automatic data exchange between PTnova and the business intelligence system is constantly monitored. All transmission errors are immediately detected by the system, ensuring that you always work with correct and current data.
360-degree consulting
HanseCom supports you in creating your individual dashboards, reports and forecasts – from design and implementation through to the visual presentation. To this end, we draw on extensive KPI catalogs and best practices when working on your projects. This guarantees a quick and successful launch of your company-specific business intelligence project.